Collaborators: Christian Schott (Lead Developer), Prof. Sebastian von Mammen (Games Engineering, Institute of Informatics, JMU Wuerzburg), Mounsif Chetitah (Games Engineering, Institute of Informatics, JMU Wuerzburg), Dr. Mara Salvator (Senior Scientist, Max Planck Institute for extraterrestrial Physics, Garching). The project wa funded by the Vogel Stiftung Dr. Eckernkamp.
The primary goal of this project is to explore innovative concepts and methods for immersive data visualization and visual analytics of big data in Virtual Reality (VR). Specifically, the focus is on enhancing the analysis of X-ray observations from the eROSITA (Extended Roentgen Survey with an Imaging Telescope Array) satellite mission, launched in 2019 by the Max-Planck Institute of extraterrestrial Physics (MPE). The project aims to facilitate the identification and classification of X-ray emitters, including galaxy clusters, black holes, and active galactic nuclei.
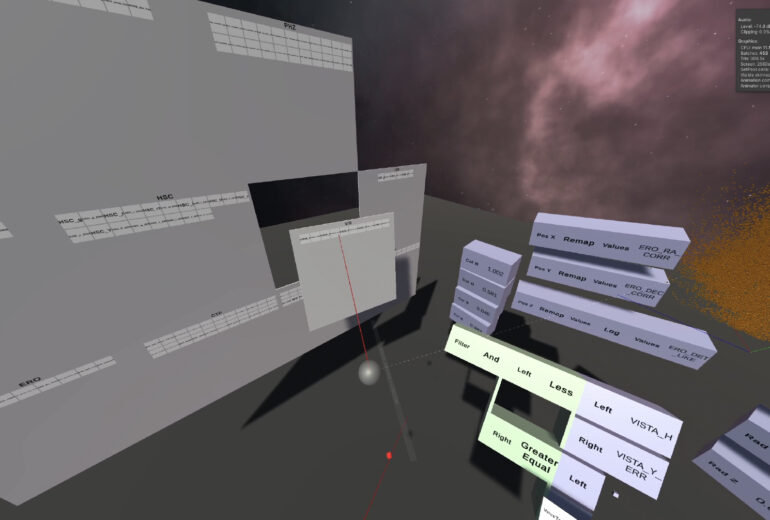
This application enables the plotting of multidimensional information related to observed X-ray emitters, providing an immersive environment for data exploration and analysis. Additionally, we integrated a connection to a Python backend, allowing for the execution and visualization of advanced data analysis algorithms within the VR space.
My role in this project was to lead the project and to lead the design thinking and brainstorming phase. I designed a natural user-interaction to map complex data to visualization in VR. Furthermore, I managed the communication between the developers and the stakeholders (senior scientists), as well as .

A comprehensive video documentation can be seen at: eROSITA VR – Documentation by Christian Schott

The design process involved close collaboration with leading scientists from the Max-Planck Institute for extraterrestrial Physics (MPE) working on the eROSITA project. Two specific use-cases were formulated to harness the benefits of VR for data analysis:
- Distinguishing X-ray Emitter Types: Given the vast distances of X-ray sources, differentiation between extended sources (e.g., galaxy clusters) and point sources (e.g., stars or black holes) is challenging. The immersive visualization aids scientists in correlating X-ray data with surveys in different wavelengths, helping differentiate emitter types.
- Error Probability Visualization: To address detection likelihood and error probability associated with measurements, a 3D virtual environment was leveraged. The VR application enables intuitive plotting of additional data dimensions, crucial for processing detected X-ray sources accurately.
The data-driven design includes Linked Views between different data visualizations (e.g., 3D UMAP visualization and traditional customizable scatterplots).
To interactively map feature columns to dimensions in the scatter plot within the VR application, a custom visual VR scripting language was developed. This language exposes 10 feature dimensions as root ‚expression blocks,‘ facilitating dynamic exploration of the extensive dataset.
In summary, this project not only pushes the boundaries of immersive data visualization but also demonstrates the practical application of VR in enhancing the analysis of complex astronomical datasets, ultimately contributing to advancements in our understanding of the universe.
