COSMIC PARAMWALKS
An interactive data visualization tool to explore multidimensional data sets in order to distinguish different classes of galaxies. The visualization is part of an astronomical study led by K. Leiter at the Chair of Astronomy, University of Würzburg.
The data set
comprises multidimensional X-ray properties of galaxies divided into two groups: those which show megamaser emission in the radio frequency band of the electromagnetic spectrum and thus provide an independent opportunity to measure the expansion of the universe, and a control group, so-called nonmaser galaxies.
The research objective
was to obtain efficient classification criteria to find megamaser candidates in future X-ray source catalogs. Typically, this is done by asking a series of question, i.e. whether or not the parameter values of a source is larger or lower than a pre-deterimed threshold. This concept is called decision tree. However, the larger the number of parameters in the data set, the harder it is to find the most efficient combinations of parameters to be checked.
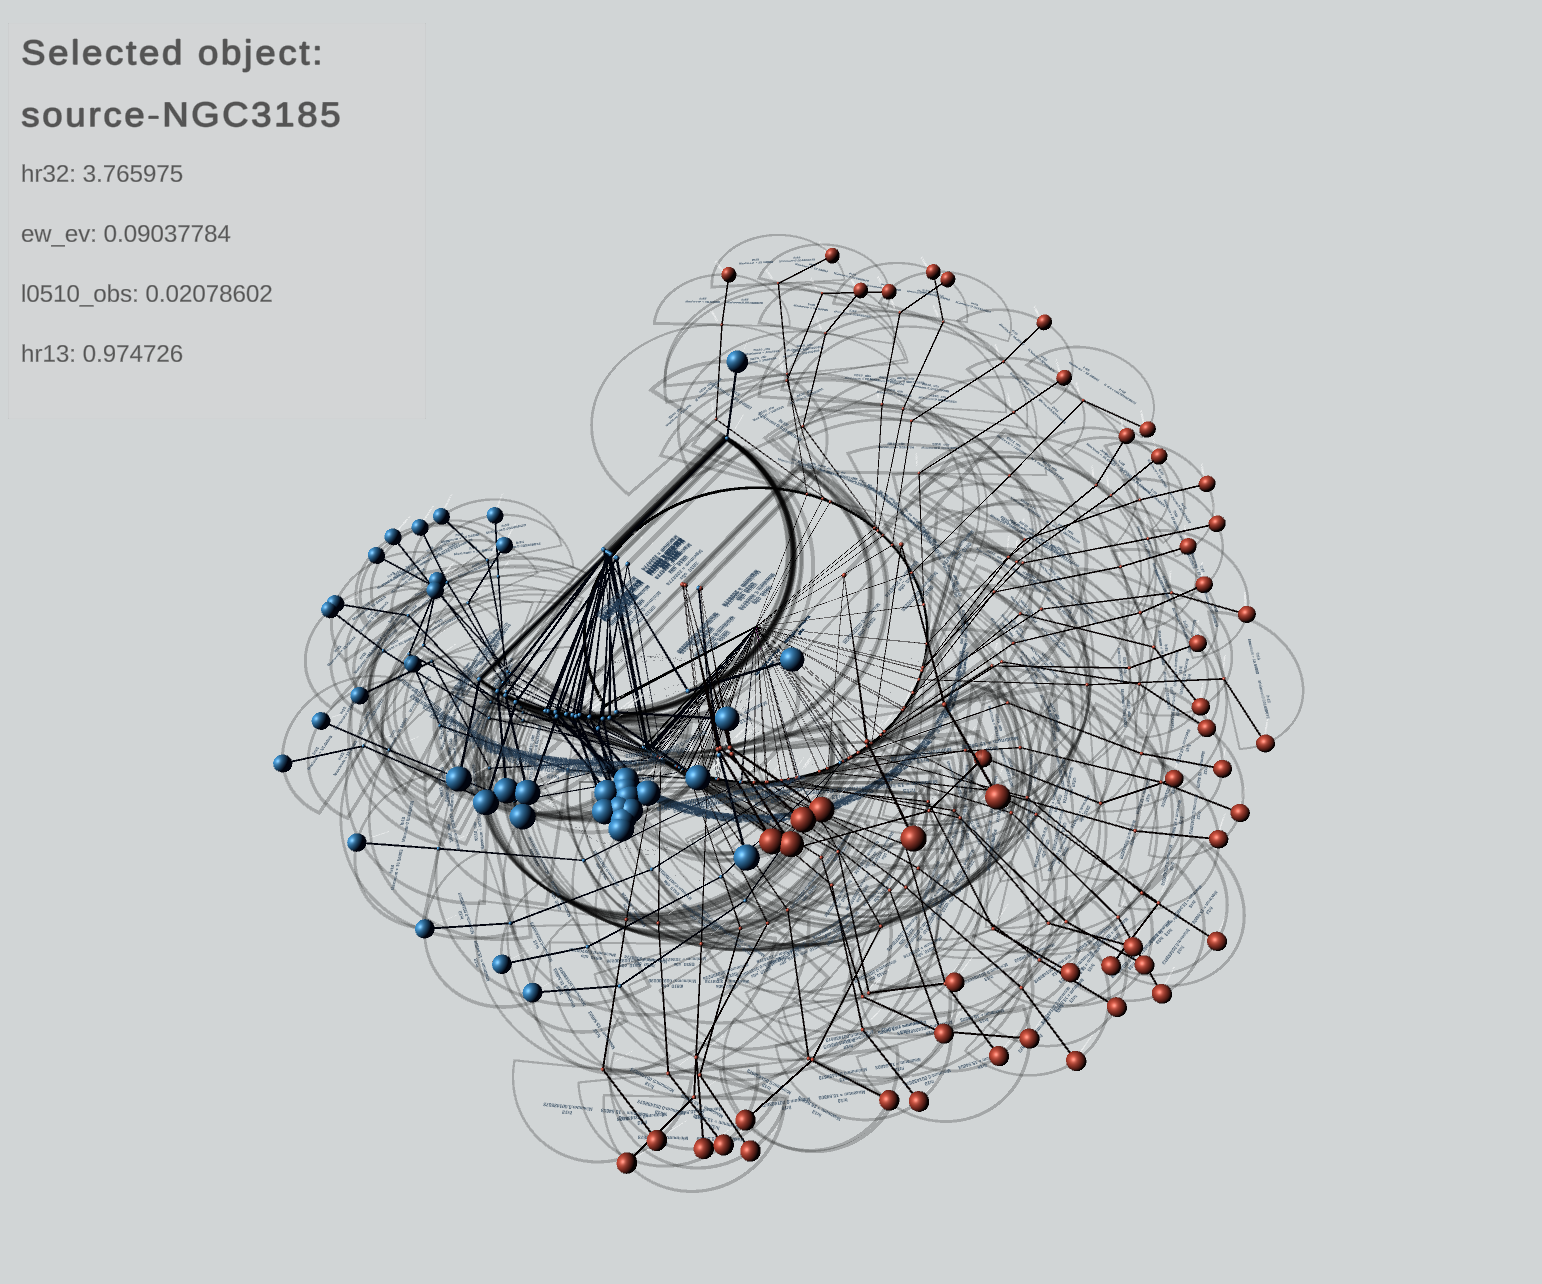
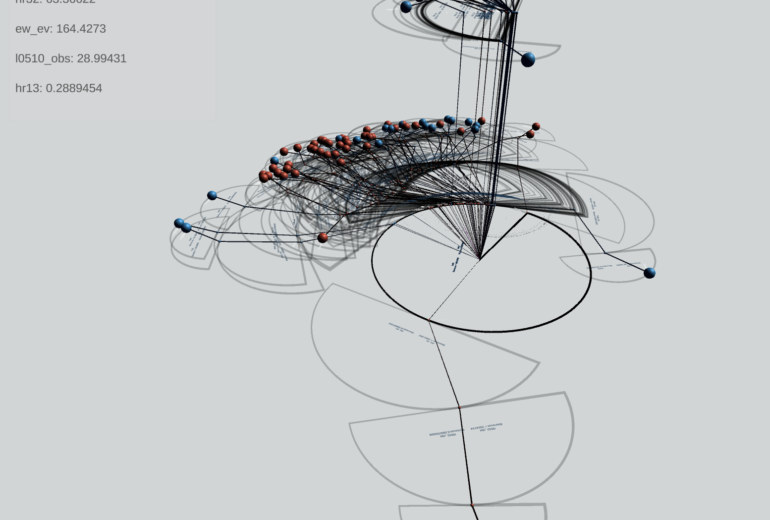
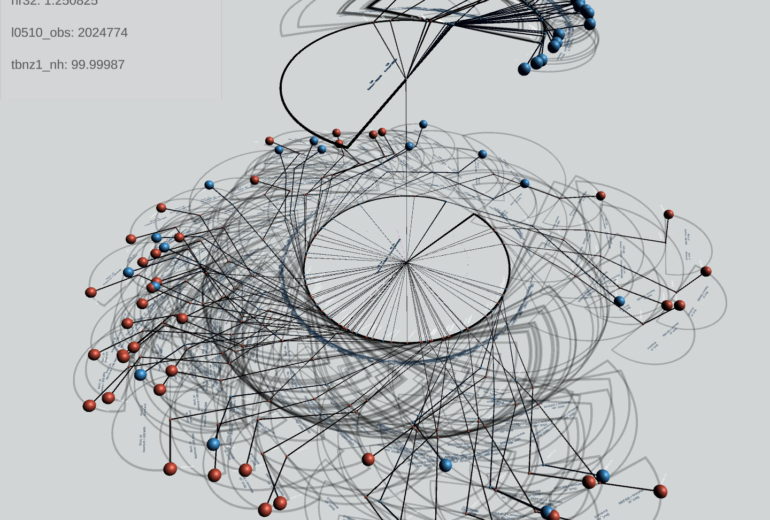
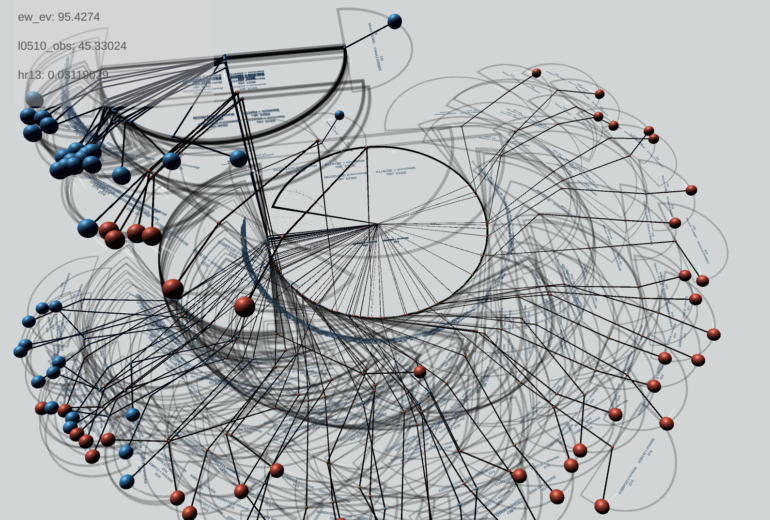
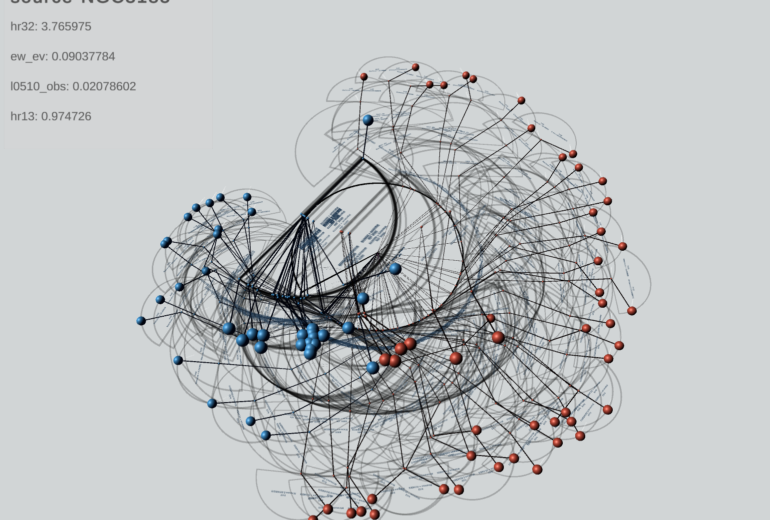
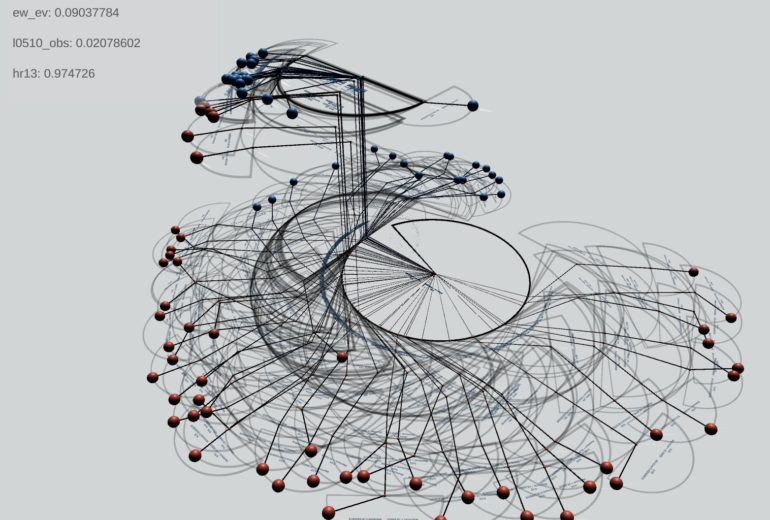
The visualization
provides a unique way to visualize and understand the similarity of sources based on their observational parameters. Each source performs a unique paths through 3D space which is solely defined by its parameter values. Similar sources will end up in the same area while distinct sources occupy different locations in space. The user can now test different parameter combinations and find the best parameter set to distinguish megamaser from nonmaser.
Interactivity & Navigation
allows the scientist to define individual parameter sets to be explored, detect and exclude outliers from the classification process and investigate the parameter values of each individual source. The user can navigate freely through 3D space using the mouse & keyboard.